
News
2024-07-14:
Version 8.16.17
now available!
Last major changes:
- added Garmin Edge 1050 to the list of devices
- several critical changes regarding the import of lap and session records
- runtime optimizations, especially when merging files
- added support for Garmin Venu 3
- added support for Garmin Edge 840/540
- many memory (RAM) optimizations, relevant for MS Access 32bits installations
- added Rouvy in list of manufacturers
- improved compatibility with Stryd files
- Batch File Rename (still beta)
- import/export/display of data field "motor power"
- added support for several new decives (Suunto, Coros, Garmin)
- added support for Garmin Edge 1040 (solar)
- added support for Garmin Forerunner 255 and Forerunner 955 Solar
- added Garmin Fenix7 and Epix to list of supported devices
- fixed an issue that could cause an error when Garmin Connect tries to save a modified activity (for instance after chaning the activity name)
- FTP library replaced due to problems with MS Defender Anti Virus
- Training Effect/Training Load data will no longer be lost when combining two files using "Append Mode"
- Import of larger fit/tcx/csv files significantly accelerated
- added support for Garmin Forerunner 745
- added support for Garmin Edge 130 Plus and Edge 1030 Plus
- Version 8.10.12: Import of fit files 30 - 40% faster than with previous versions
- Import function for Golden Cheetah JSON files implemented
- Improved handling of Suunto fit files without Start/Stopp events
- nutrion data is imported, exported and displayed in "session details"
- added support for DashWare CSV files (import)
license issue removed (thanks! for the confidential hint!) - workaround for "query is corrupted" message after installing Windows Update implemented
- support of MTB Dynamics data fields added
- new feature for combining (merging) bike computer/running watch recording with VR (Zwift etc) recording
- Developer data fields can be created
- contents of native data fields can be copied into developer data fields
- Information about Personal Data (Data Privacy) in imported and exported file added
- memory usage optimized - handling of large fit files strongly improved
- File Upload to komoot
- Option "Export as FIT file using FIT file definition 1.0" added
- Options "Export to MS Access Database" and "Export to MS Excel document" added
- "AutoCompact" option of MS Access enabled-> cached data will be removed and file size will be reduced when the tool is closed
- User Manual updated
- additional Trainige Effect data are being imported and exported
- improved export to and re-import from MS Excel
- new file upload functions for Strava and TrainingPeaks
- improved Workout Editor
- improved HRM file import
- Fixed some date issues in import / export of HRM files
- Improved compatibility with Hammerhead Karoo .fit files
- Optimized GPS distance calculation
- Export as Sigma SLF file implemented
- Increased compatibility between Wahoo Elemnt .fit files and Garmin Connect
- New Import option: "Large File Mode"
- Issues with Data Developer Fields fixed
- Improved .fit Course File Export
- Import function for iBike CSV files added
- "Elevation Correction" improved
- Compatibility with Wahoo Elemnt/Bolt improved
- Import of PWX (Peakware) files added
- Export your activity as ZWIFT workout (ZWO)
- Import of RowPro Rowing files added
- Import of PainSled Rowing files added
- Import and Export of .fit files with Developer Data added
- Select temperature unit (C/F) independently from distance unit (km/mi)
- Added support for "Time in Heart Rate Zones" and "Time in Power Zones" diagrams in Garmin Connect
- Added support for Import of Wahoo Elemnt files (.fit and .csv)
- 7.2. Creation of Course files (with turn by turn course points) added
- 7.1. Support for Fenix 3 HR added
- 7.1. Improved tcx file import for Polar files
- 7.1. Import of segments fit files added
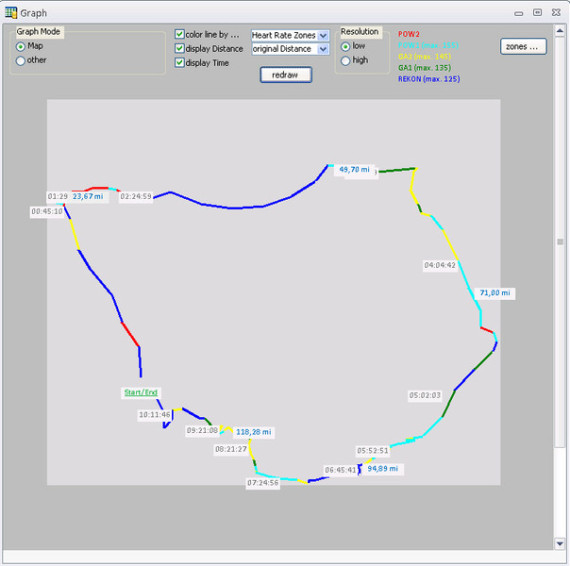
- 7.1. (Map &) Chart function improved
- 7.1 Support for Monitor Files of Activity Trackers added
- 7.1 Import of SRM activitiy recordings (CSV format) added
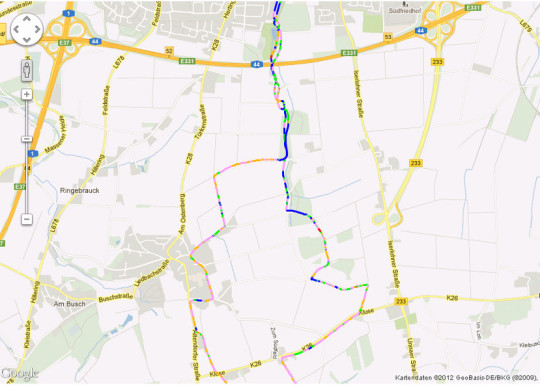
- 7.1 Display your activity in Google Earth!
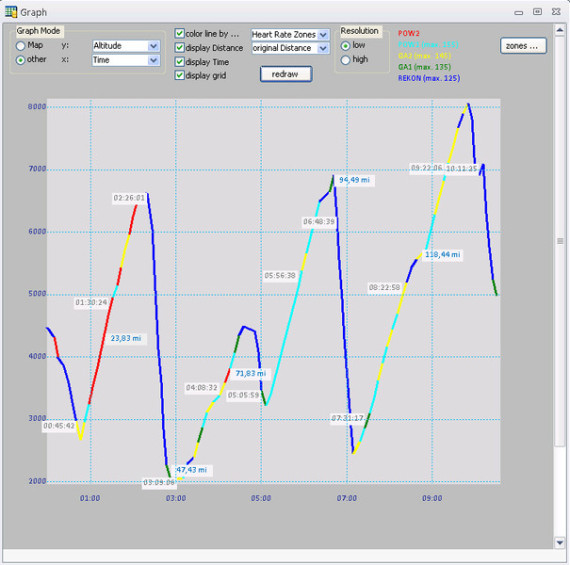
- 7.0 New diagrams implemented (Line graphs for heart rate, speed, cadence, altitude, temperature etc)
- 7.0 Import of Painsled Rowing files added
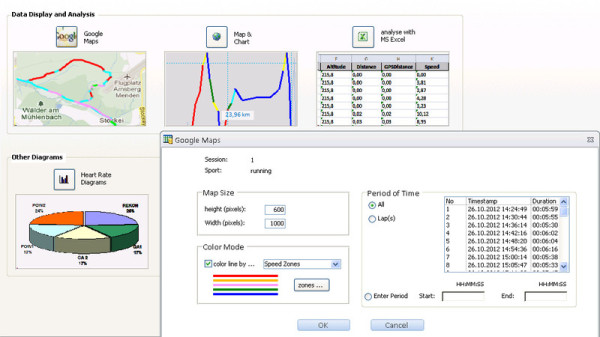
- 7.0 Improved Display of activity in GoogleMaps (added Weather Information: temperature, wind speed, wind direction)
- 7.0 Export of Courses as tcx files added
- 7.0 added support for TACX and bkool indoor trainers .fit files
- 7.0. added support (import, export) of Virb XE files
- 6.5. added support (import, export) of swim files with heartrate data/ R R values
- 6.5. added support for TCX files created by "Tacx film"
6.5. fit files created by "Teasy One" devices can be imported now - 6.5 Dynamic speed values for courses/"Virtual Partner"
- 6.4. Gear Usage Diagrams added
- 6.4. Algorithm for "Gear Guessing" added (beta)
- 6.4 check and modify crank length settings in settings.fit
- 6.3. added support for Virb X files
- 6.3. additional timestamp correction algorithm implemented
- 6.3. solved an issue with editing pool swim files
- 6.2. (07/2015)
corrected an issue with editing pool swim files - 6.2. (06/2015) Workout Editor added (Settings-Program Settings-Activate Workout Editor)
- 6.2.11 (05/2015) Message Type "Record": new comparison of data fields added (see window "Message Type Details")
6.2. Garmin's new data fields "Time Standing" and "Standing Count" implemented (Import & Export) - 6.1 (05/2015) Sigma SLF file import implemented
- 6.1 (05/2015) HRM file export improved
- 6.0. (03/2015) Strongly improved repair functionality
- 6.0. (03/2015) Merge Session function implemented
- 6.0 (03/2015) Improved Cycling Dynamics data support
- 5.22. (01/2015) Improved Batch File Conversion (fit, tcx, hrm)
- 5.22. (01/2015) Improved Editing of Pool Swim Activities
- 5.22. (01/2015) Improved Elevation Correction
- 5.22. (01/2015) Improved Error Correction (if GPS data is corrupted at the beginning of the recording)
- 5.22. (01/2015) Fixed an issue with export of cycling dynamics data
- 5.22 (12/2014) Calculation of Max Avg. Power 5/20/60 minutes added on register tab "Power"
- 5.22 (12/2014) Import function for First Degree Fitness (FDF) files added
- 5.22. (12/2014) Handling (Repair & Export) of Pool swim files strongly improved
- 5.21 (11/2014) totals.fit of Edge 1000 running firmware version 2.7 can be modified, even total values of activity profiles
- 15.21. (11/2014) support of new "Cycling Dynamics" data fields
- 5.20. (10/2014) Improved Timestamp Correction
- 5.20. (10/2014) improved Elevation Correction
- 5.19. (10/2014) Added Forerunner 920XT support
- 5.19. (10/2014) Calculate Normalized Power (NP) per LAP
- 5.19. (10/2014) Import of Suunto XML / SML files added
- 5.19. (10/2014) DI2 gear info is imported and transferred to MS Excel
- 5.19 (09/2014): German User Interface added
- 5.18 (06/2014): Estimated power values
- 5.18 (06/2014): Support of Garmin Edge 1000 files added
- 5.18. (06/2014): Support of Magellan/Mio 505 .fit and .gpx files added
- 5.18 (06/2014): Batch File Conversion (FIT <-> TCX <-> HRM)
- 5.18 (06/2014): Batch File Upload to Garmin Connect, Strava etc.
- 5.17 (05/2014): New File Upload to Strava
- 5.12 (03/2014): Conversion Activty -> Course and Course -> Activity

